
Mobile and Web Apps#
Contents
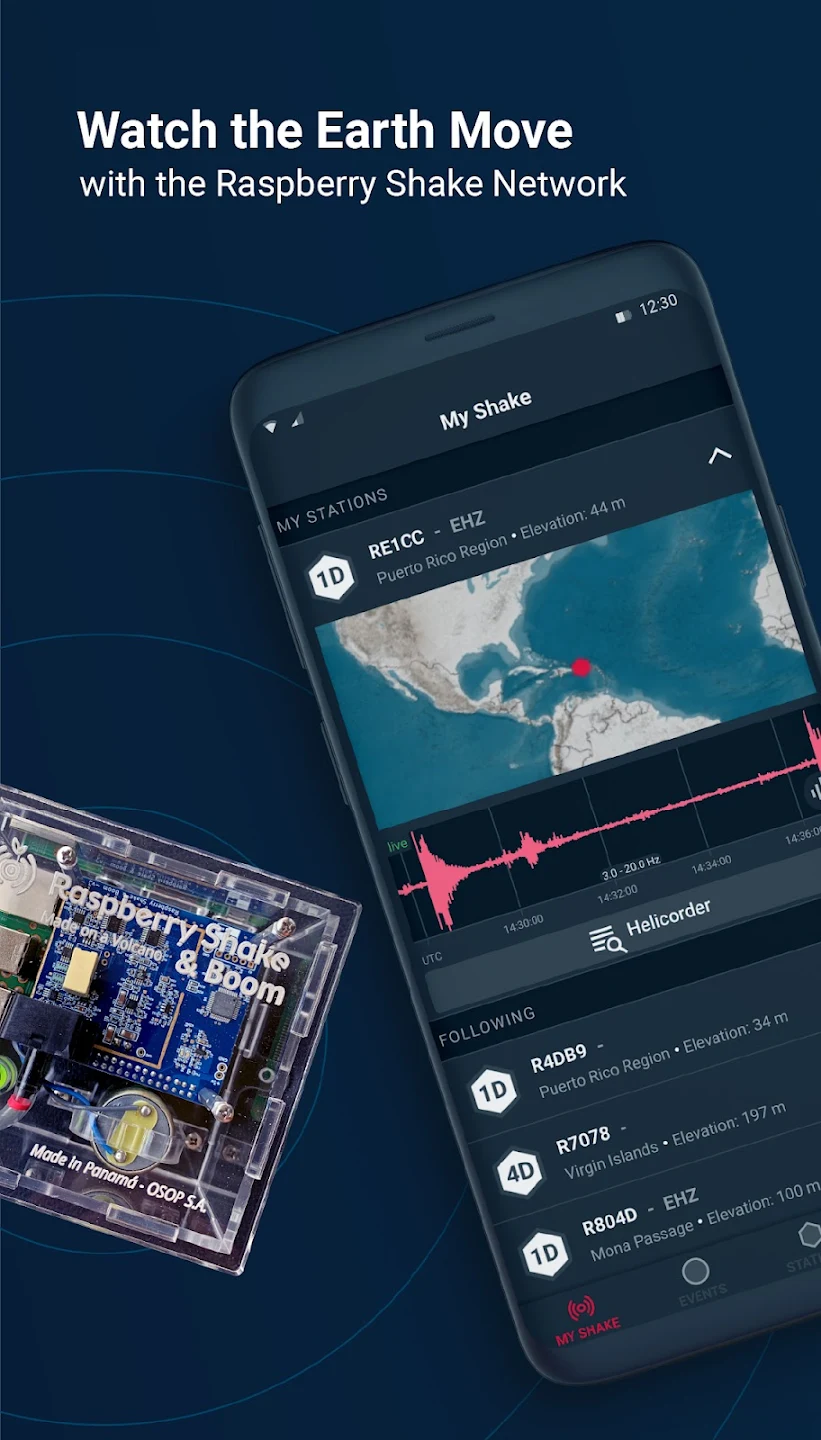
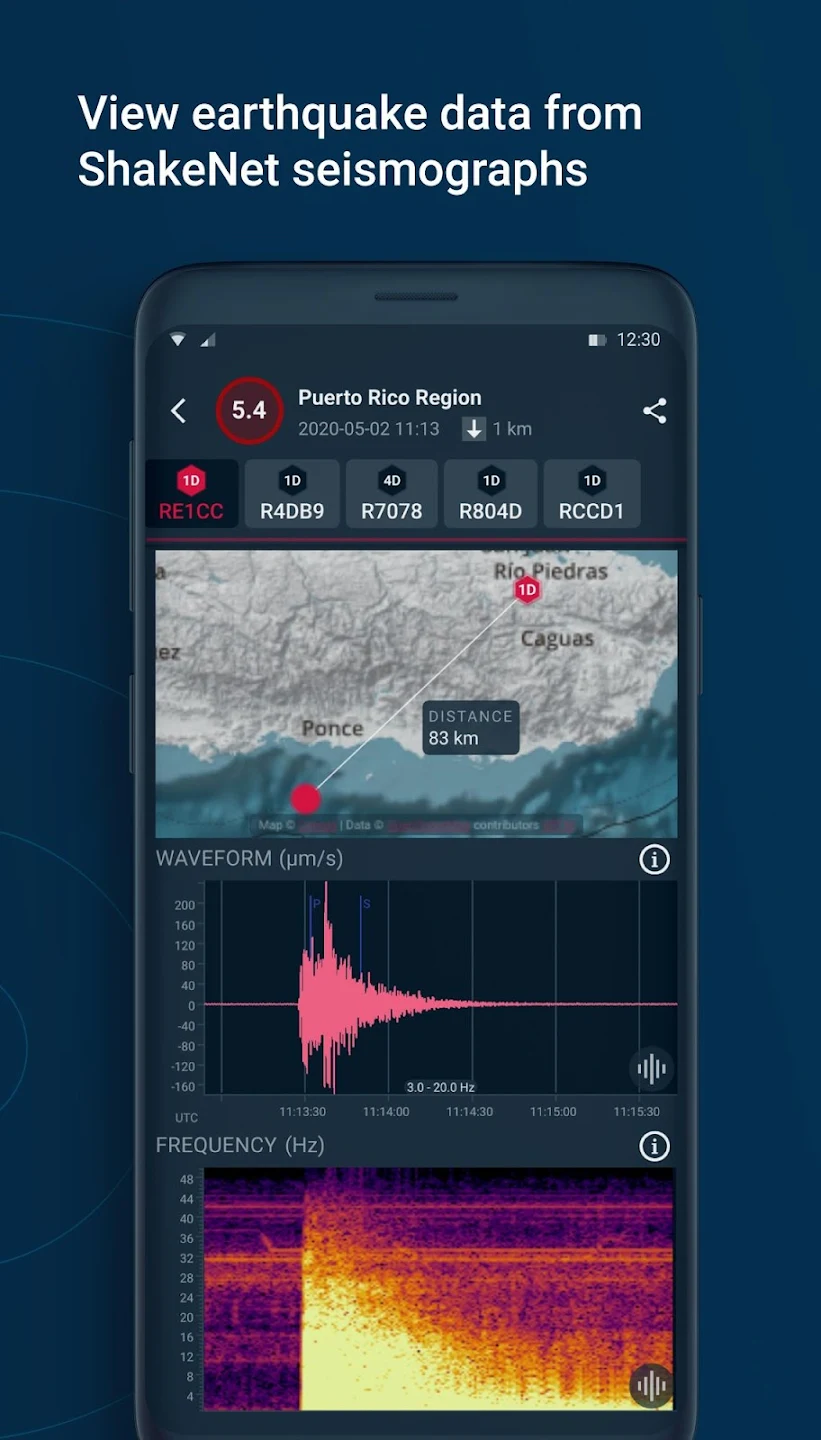
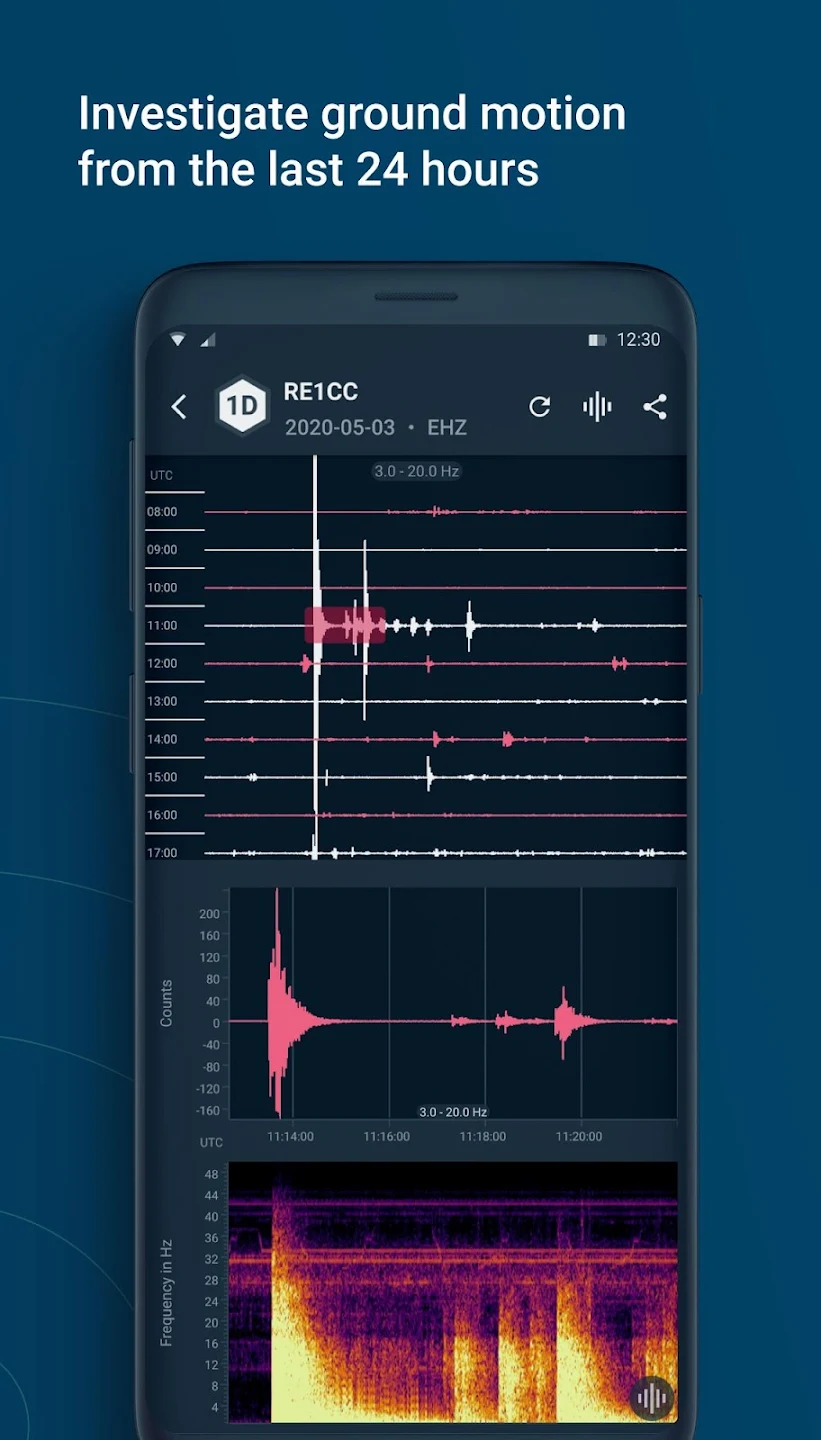
ShakeNet Mobile App#
Visualize your Raspberry Shake’s data on our mobile app! Available for both Android and iPhone!
Station and Earthquake Map (StationView)#
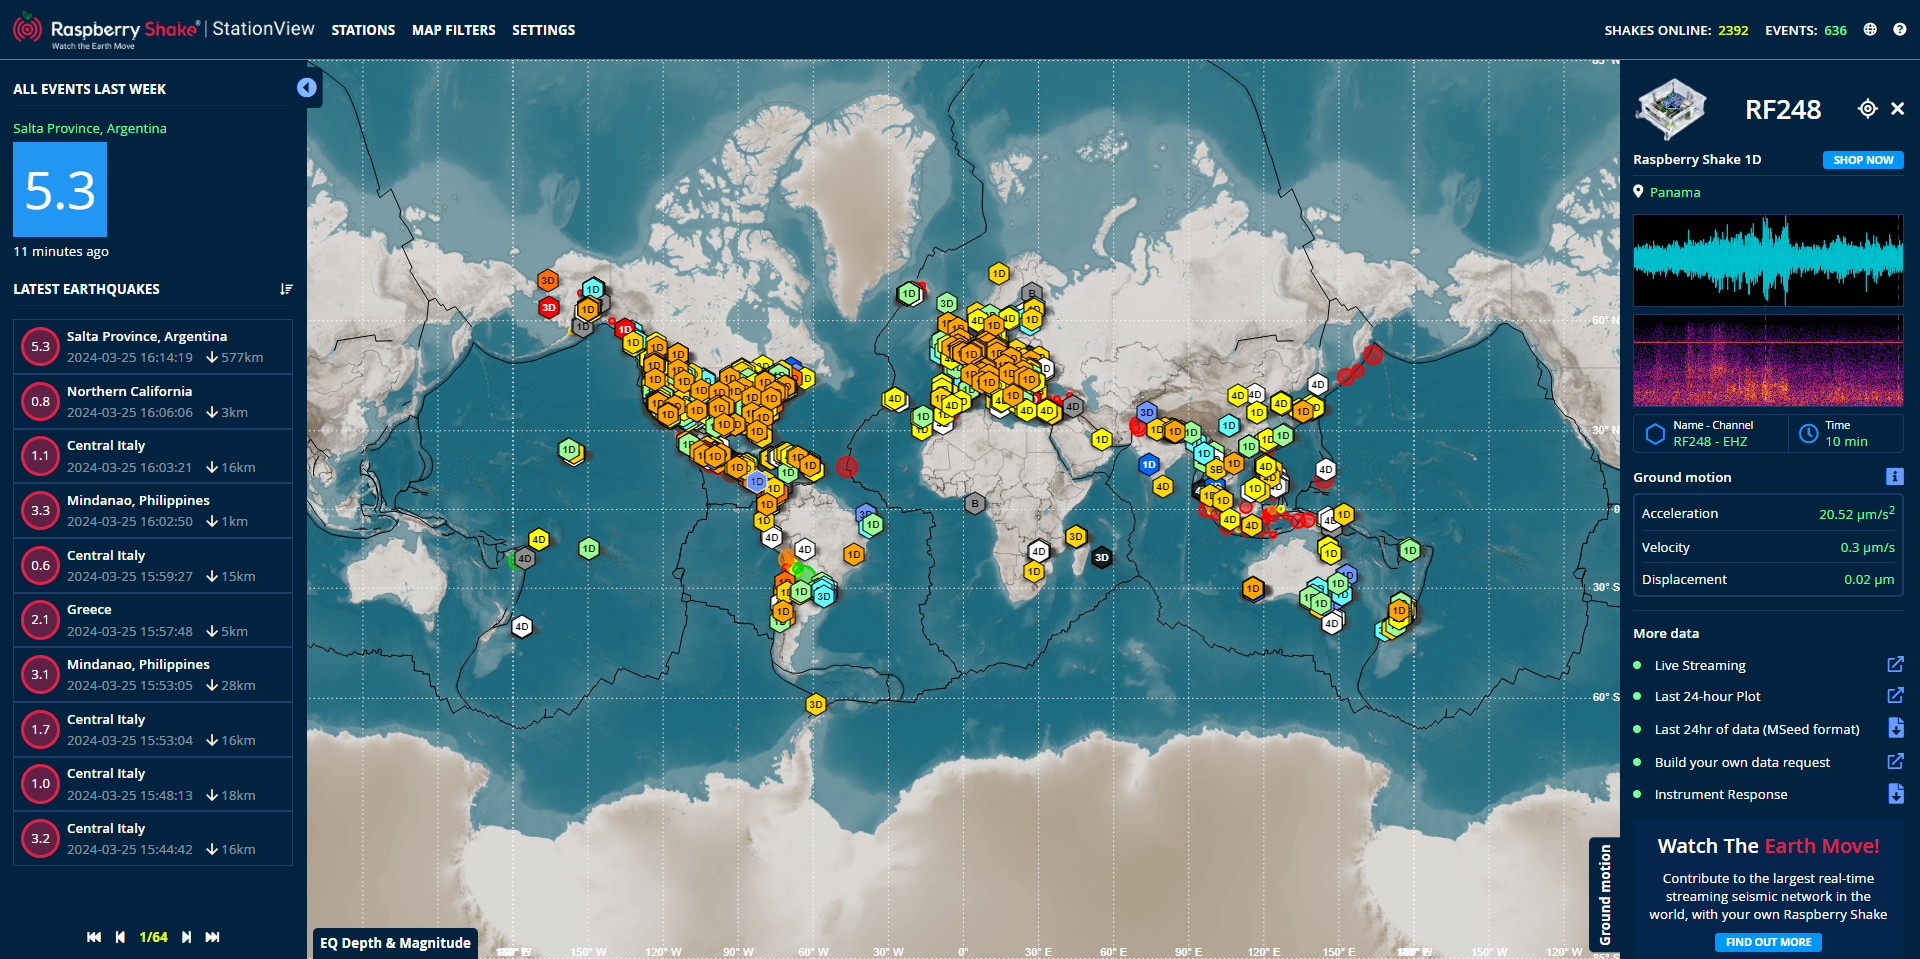
Find your Raspberry Shake Station on our interactive global map, showcasing our network’s live data streams, and powered by you! Access a comprehensive list of the latest global earthquake activity, explore events recorded on any station, and watch data feeds stream in real-time.
Note
It is possible to fully customize the latitude, longitude, and zoom level parameters of StationView, to be able to bookmark and show the page always set to a precise location. Some general examples follow:
https://stationview.raspberryshake.org/#/?net=AM&sta=R1607 - Center the map around the given Shake and show the given shake data in the right sidebar
https://stationview.raspberryshake.org/#/?net=AM&sta=R1607&lat=12&lon=40&zoom=10 - Center the map around coordinates 12;40 with zoom level 10 and show the given Shake data in the right sidebar
https://stationview.raspberryshake.org/#/?lat=12&lon=40&zoom=10 - Center the map around coordinates 12;40 with zoom level 10 and do not show any data
This is a map of global earthquake solutions paired together with real-time data from all the stations in the Raspberry Shake network.
This means that YOU are contributing to the largest Citizen Science earthquake network in the world!
The denser the network, the more accurate the collected data will be. So please help us spread the word.
Note
What do the channel acronyms (EHZ, HDF, etc.) mean? Use this comprehensive list as a memo!
SHZ / EHZ = Vertical geophone channel (up-down weak motion)
EHE = East-West geophone channel (longitudinal weak motion)
EHN = North-South geophone channel (latitudinal weak motion)
ENZ = Vertical accelerometer channel (up-down strong motion)
ENE = East-West accelerometer channel (longitudinal strong motion)
ENN = North-South accelerometer channel (latitudinal strong motion)
HDF = Infrasound RBOOM/RSBOOM channel (air pressure differences)
Data Visualization Tool (DataView)#
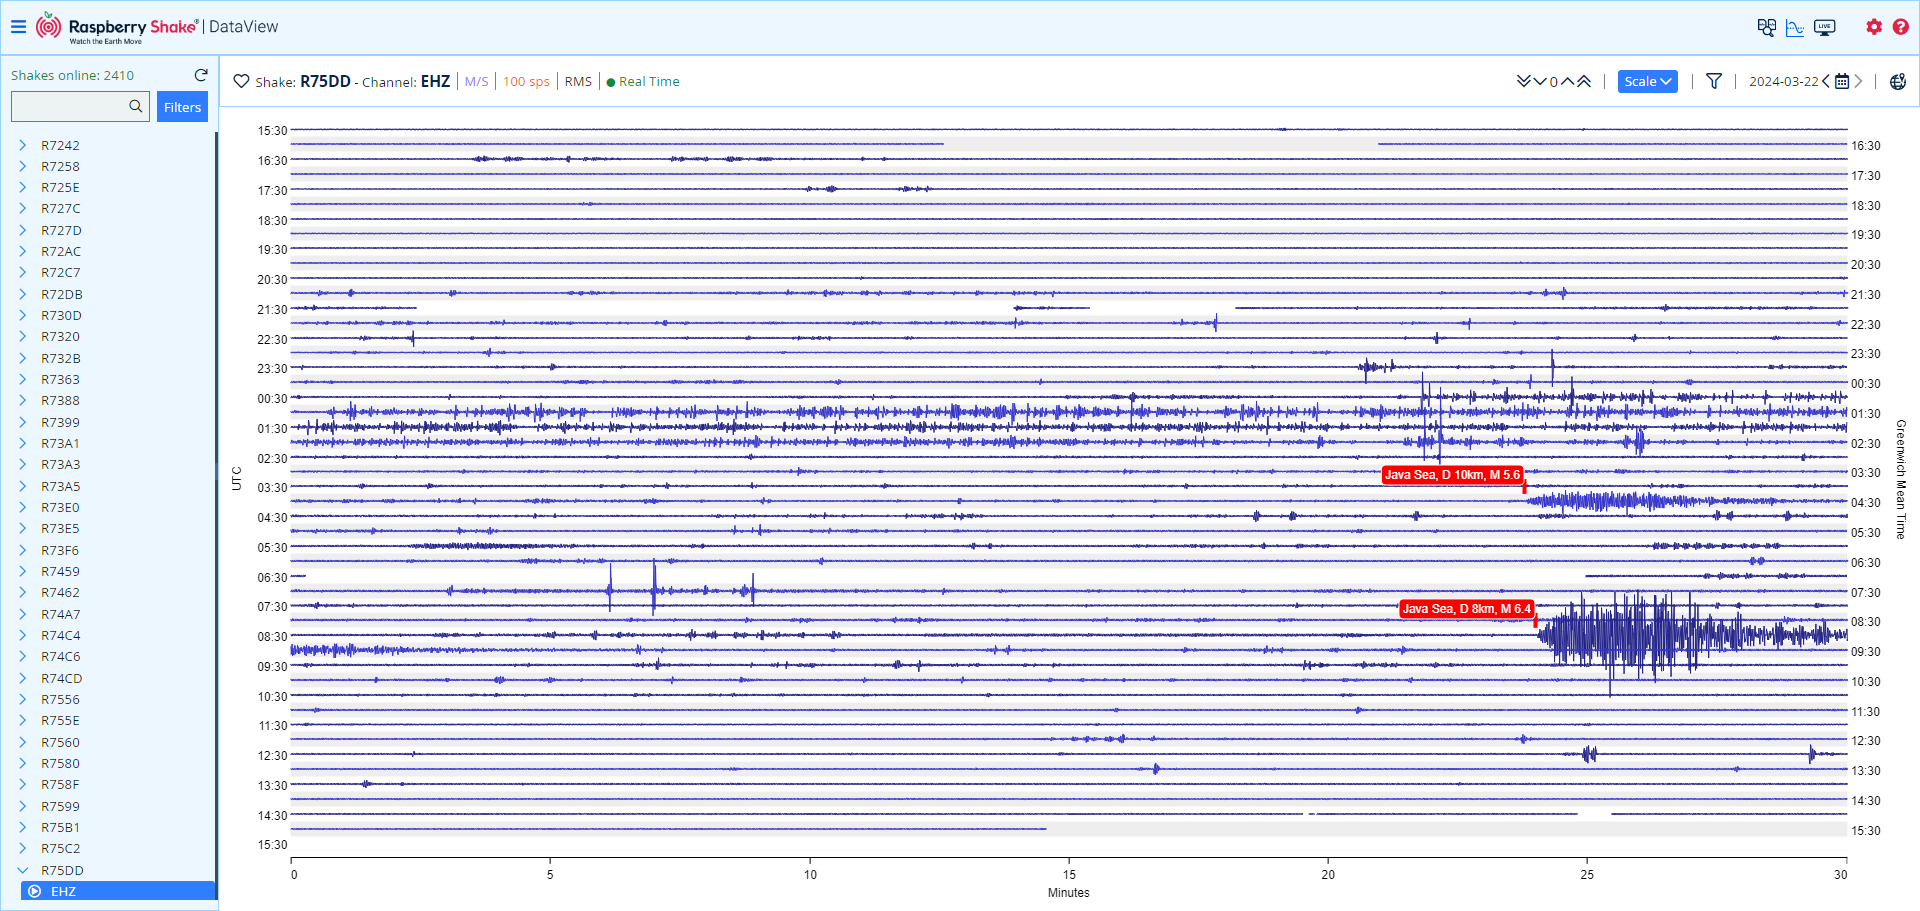
Visualize data from all Raspberry Shake stations, across all channels, across recorded time. DataView empowers advanced users to explore Shake data in their browser, visualizing seismograms, spectrograms, applying filters, and performing frequency domain analysis.
Note
It is possible to show live data from any Raspberry Shake connected to the network in kiosk mode in two ways:
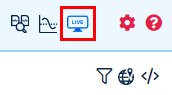
By going to the Shake DataView page and clicking on the Live Data Display button, then pressing F11 to enter fullscreen:
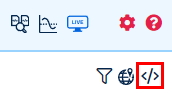
By using our iframe HTML embed feature via either:
Clicking on the embed button in the Live Data Display page, which will provide a ready-to-use HTML code:
Adapting this generic embed code:
<iframe width="500" height="350" src="https://dataview.raspberryshake.org/#/embed/AM/R1234/00/EHZ"></iframe>
changing the Shake name (R1234) and its channel (EHZ, HDF, or another) and display it on any web page.
Note
What do the channel acronyms (EHZ, HDF, etc.) mean? Use this comprehensive list as a memo!
SHZ / EHZ = Vertical geophone channel (up-down weak motion)
EHE = East-West geophone channel (longitudinal weak motion)
EHN = North-South geophone channel (latitudinal weak motion)
ENZ = Vertical accelerometer channel (up-down strong motion)
ENE = East-West accelerometer channel (longitudinal strong motion)
ENN = North-South accelerometer channel (latitudinal strong motion)
HDF = Infrasound RBOOM/RSBOOM channel (air pressure differences)
Sound App (EQ Sound)#
Earthquake example: As recorded by Raspberry Shake
Rocket launch example: Feb, 2018 SpaceX Falcon Heavy from 10 km away, as recorded by the Raspberry Boom
What it does:
raspishake2sound generates a video showing the waveform and spectrum together and converts the waveform to the audible frequency range of the human ear.
Note that the audible frequency range of the human ear is 20 - 20,000 Hz and most earthquake energy is in the roughly 0.8 to 5 Hz range, or well below what is audible.
Output format: MP4
How is an earthquake/ waveform converted to sound?:
What you hear is the normalized samples of the input trace, fed to the sound card with a higher sampling rate. In a way, you indeed listen to the earthquake.
Note
Technical details: Samples of the input trace are
normalized (max.value becomes 1, other samples scaled accordingly);
written to a MP4 file with a new sampling rate (more on this below); and
this MP4 file is amplified by 10 dB and re-sampled to some standard audio sampling rate like 44100Hz.
The new sampling rate from step 2) is determined as follows: the input sampling rate is just multiplied by 140.
This makes a trace recorded at 50 Hz (SHZ channels) become a sound sampled at 7000 Hz (quite audible), and a trace recorded at 100 Hz (EH?/EN? channels) becomes a sound with a 14000 Hz sampling rate. Because the number of samples remain the same, the MP4 file becomes 140 times shorter than the input trace. For example, 900s of input trace becomes ~6.4s of audio.
Re-sampling summary:
Normal: 50 Hz becomes sound sampled at 7000 Hz
Twice as slow: 50 Hz >> 3500 Hz
Four times as slow: 50 Hz >> 1750 Hz
How is event list populated?:
global events fetched: M6.5+ in last month
regional events fetched: M4.5+ in last month within 5° of station, where 1° = ~112.5 km
local events fetched: any event within 1 degree of station, last month
The same events are returned as are available on StationView.
This is not configurable, but you can always enter the event time if you want to look at an event that does not appear in the list.